Band Gap Analysis#
Calculation Details#
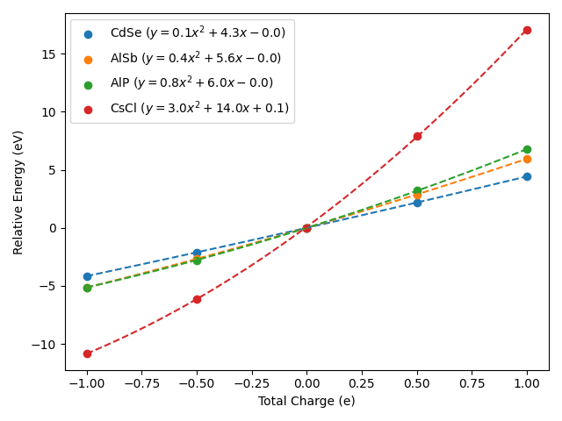
- The energy change is calculated by varying the total charge of the system, and the band gap is estimated from its second derivative.
Target Structure#
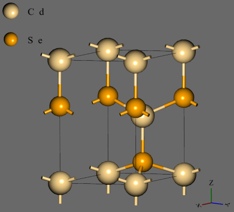 CdSe (a=4.30Å, c=7.01Å) |
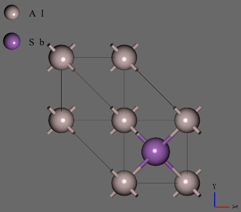 AlSb (a=6.14Å) |
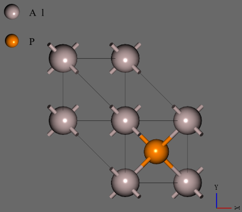 AlP (a=5.46Å) |
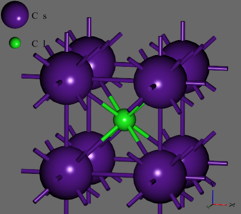 CsCl (a=4.12Å) |
Calculation Conditions#
The same values were used for all parameters common to AOF-DFT and KS-DFT.*
| Parameter | Value |
|---|---|
| Pseudo-atomic orbital | Cd7.0.pao, s1p1d1 Se7.0.pao, s1p1d1 Al7.0.pao, s1p1d1 Sb7.0_as.pao, s1p1 P7.0.pao, s1p1d1 Cs13.5_as.pao, s2p1d1 Cl7.0.pao, s1p1d1 |
| Pseudopotential | Cd_PBE19.vps Se_PBE19.vps Al_PBE19.vps Sb_PBE26_as.vps P_PBE19.vps Cs_PBE26_as.vps Cl_PBE19.vps |
| Functional model (AOF-DFT only) | Crystal26 |
| Energy cutoff | 150 Hartree |
| k-point density (KS-DFT only) | 3.5 point/Å-1 |
| Smearing width | 0.02 Hartree |
| Convergence threshold | 1.0×10⁻⁶ Hartree |
| Total charge | -1.0 ~ +1.0 |
- Only for the KS-DFT calculation of AlSb, the basis sets were set to s2p1d1 for Al and s3p2 for Sb.
Calculation Results#
- The qualitative trend of the band gaps is correctly reproduced.
| Band Gap (eV) | AOF-DFT | KS-DFT* (OpenMX) | KS-DFT1 |
|---|---|---|---|
| CdSe | 0.27 | 0.10 | 0.56 |
| AlSb | 0.80 | 0.83 | 1.23 |
| AlP | 1.65 | 1.75 | 1.63 |
| CsCl | 6.09 | 3.61 | 4.99 |
- Values read from the band diagram
|