Prediction of volume dependence of total energy by cooperation function with Python#
You can execute various operations via Python scripts on Advance/NanoLabo. Using Python scripts enables you to automate complicated workflows.
We analyzed unit-cell volume dependence of total energy of single-crystal Ge. We generated 31 models with different volume and analyzed calculation results using Python scripts.
Warning
We put sample code1 on this page to introduce cooperation function with Python of Advance/NanoLabo, but we don’t guarantee their operations. Please see the online manual for information on how to use the cooperation function with Python.
Generation of models with different volume#
|
|
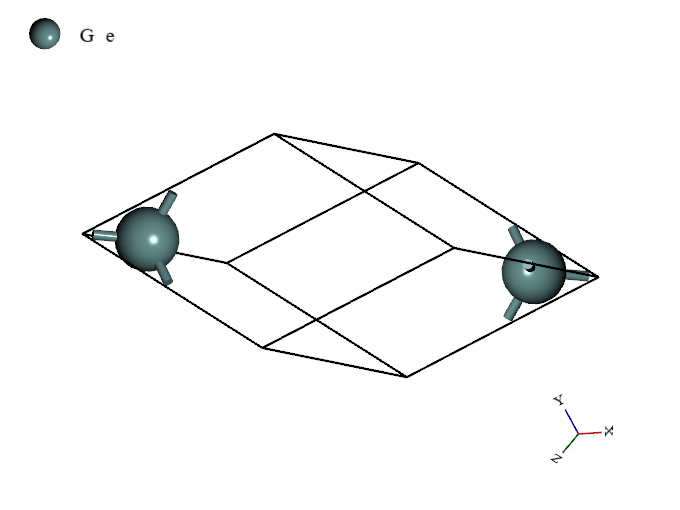
Optimized structure of single-crystal Ge
|
First, we imported optimized structure of single-crystal Ge2 into Python and created a new project. Next, we scaled unit-cell of the project isotropically3. By repeating this procedure with changing scale, we generated 31 models with different volume.
1 2 3 4 5 6 7 8 9 10 11 12 13 14 15 16 17 18 | |
Execution of calculation#
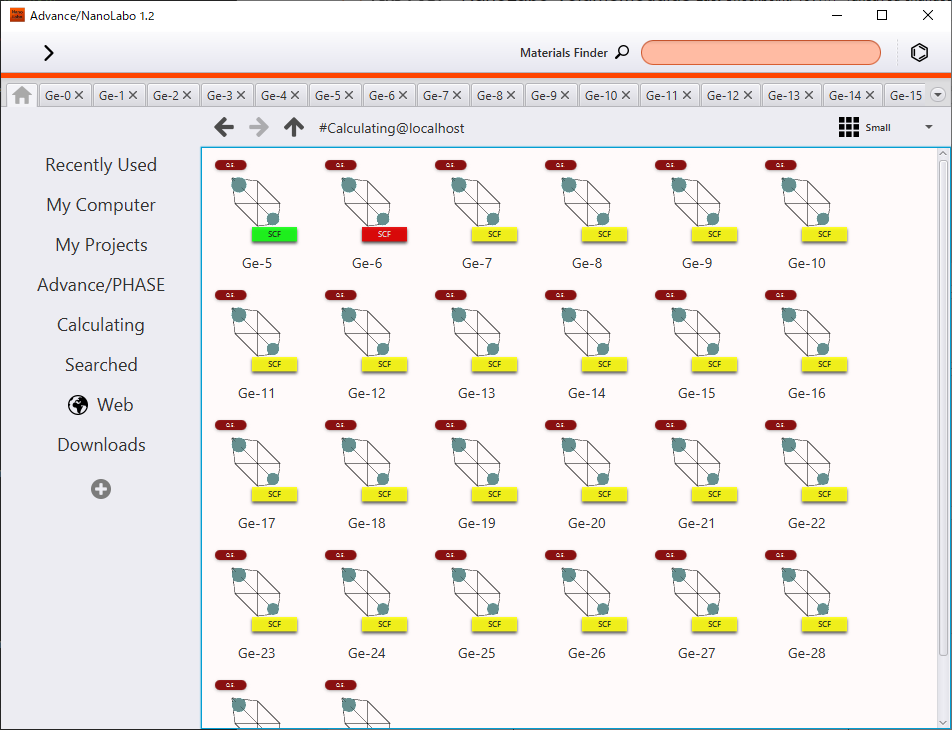
We executed calculation by calling run_project function and specifying project name.
1 2 3 | |
|
|
List of finished/running/waiting calculation jobs
|
Analysis of volume dependence#
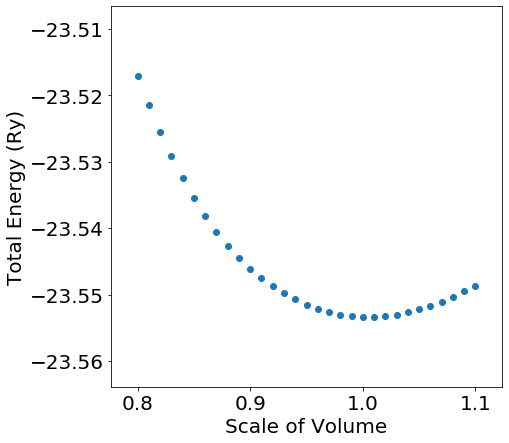
After the calculations finished, we got the total energy of each model by calling qe_get_total_energy function and plotted the results in the figure, in which the horizontal axis corresponds to the scale of volume and the vertical axis corresponds to the total energy.
1 2 3 4 5 6 7 8 9 10 11 12 13 14 | |
|
|
Volume dependence of total energy
|
In comparison with the equilibrium structure, if scale of volume is in a range of , total energy change is below . Also, we can see from the result that total energy increases by compared with the equilibrium structure when volume is compressed by .
Such an analysis of volume dependence of total energy enables you to predict physical properties like volume elasticity and transition pressure.
関連ページ#
- ナノ材料解析統合GUI Advance/NanoLabo
- 解析分野:ナノ・バイオ
- 産業分野:材料・化学
- Advance/NanoLabo Product Information
- Advance/NanoLabo Documentation
-
The sample code was written assuming since Python3.7. NumPy and Matplotlib were used in the sample code. For infomation of these, please visit each official website. ↩
-
We carried out structural optimization on Advance/NanoLabo and saved the result as Ge-Optimized.cif beforehand. ↩
-
You can edit not only unit cell but also atomic coordinates via Python scripts. ↩